


9.1.1概述
简介
Ping是一个计算机网络的管理工具,用于测试一台主机通过IP协议的可达性和衡量每次从源到目的主机的时间(round trip time)。它的名字来源于主动声纳的术语。
Ping通过向目的主机发送ICMP echo请求报文,等待ICMP回应来实现。在运作过程中,它测量每一次发送到接收到响应的时间间隔(round trip time),并且记录所有的丢包。测试结果会用一个统计汇总数据来显示接收到的所有报文,包括最小,最大和平均的round-trip time,有时会打印平均的标准偏差值。
Traceroute是一个在IP网上用于测量路由选路和报文传输时间的工具。
Traceroute向目的主机发送一个ICMP序列报文,通过TTL参数跟踪通过的中间路由。中间路由器会将过路报文的TTL参数值减1,当TTL值减为0时丢弃报文并回送一个ICMP错误消息(ICMP Timer Exceeded)给发送源。
9.1.2配置举例
Ping内部接口的IP地址
Switch# ping 10.10.29.247
Switch# ping ipv6 2001:1000::1
Ping管理口的IP
Switch# ping mgmt-if 10.10.29.247
Switch# ping mgmt-if ipv6 2001:1000::1
Ping VRF实例的IP
Switch# ping vrf vrf1 10.10.10.1
Traceroute内部接口IP
Switch# traceroute 1.1.1.2
Switch# traceroute ipv6 2001:1000::1
Ping 命令举例
Switch # ping mgmt-if 192.168.100.101
PING 192.168.100.101 (192.168.100.101) 56(84) bytes of data.
64 bytes from 192.168.100.101: icmp_seq=0 ttl=64 time=0.092 ms
64 bytes from 192.168.100.101: icmp_seq=1 ttl=64 time=0.081 ms
64 bytes from 192.168.100.101: icmp_seq=2 ttl=64 time=0.693 ms
64 bytes from 192.168.100.101: icmp_seq=3 ttl=64 time=0.071 ms
64 bytes from 192.168.100.101: icmp_seq=4 ttl=64 time=1.10 ms
--- 192.168.100.101 ping statistics ---
5 packets transmitted, 5 received, 0% packet loss, time 4054ms
rtt min/avg/max/mdev = 0.071/0.408/1.104/0.421 ms, pipe 2
traceroute 命令举例
Switch# traceroute 1.1.1.2
traceroute to 1.1.1.2 (1.1.1.2), 30 hops max, 38 byte packets
1 1.1.1.2 (1.1.1.2) 112.465 ms 102.257 ms 131.948 ms
Switch # ping mgmt-if ipv6 2001:1000::1
PING 2001:1000::1(2001:1000::1) 56 data bytes
64 bytes from 2001:1000::1: icmp_seq=1 ttl=64 time=0.291 ms
64 bytes from 2001:1000::1: icmp_seq=2 ttl=64 time=0.262 ms
64 bytes from 2001:1000::1: icmp_seq=3 ttl=64 time=0.264 ms
64 bytes from 2001:1000::1: icmp_seq=4 ttl=64 time=0.270 ms
64 bytes from 2001:1000::1: icmp_seq=5 ttl=64 time=0.274 ms
--- 2001:1000::1 ping statistics ---
5 packets transmitted, 5 received, 0% packet loss, time 3997ms
rtt min/avg/max/mdev = 0.262/0.272/0.291/0.014 ms
9.2.1概述
简介
NTP是一个具有冗余能力的分层时间分布系统。NTP测量内网延迟和设备上运行它的算法的延误。使用这样的技术,NTP可以使LAN内的设备时间同步,精度达到毫秒级,WAN上的设备时间同步,精度达到百毫秒级。NTP时间分布树的分层特性使用户能通过一个等级(层级)选择需要的精度。一台时间服务器,放置在树的高端(低层级),提供了高精度的UTC标准时间。
主机可作为时间服务器,他们提供了他们认为是正确的时间到其他主机。主机也可作为客户端,向服务器请求时间同步。主机也可既充当客户端又当服务器,因为这些主机是在一个链路上,正确的时间从一个主机转发到另一个主机上。作为这个链路的一部分,首先一台主机作为一个客户端从另一台作为时间服务器的主机获取正确的时间。然后作为其他主机同步时间的时间服务器。
9.2.2配置举例
配置 client/server 模式带内连接方式
配置NTP客户端之前请确认NTP服务器已开启NTP服务:
1.组网拓扑

图9-1带内口连接NTP服务器
2.配置步骤
步骤 1进入配置模式
Switch#configure terminal
步骤 2配置设备与服务器之间的三层网络
进入vlan配置模式,并创建vlan
Switch(config)# vlan database
Switch(config-vlan)# vlan 10
Switch(config-vlan)# exit
进入接口配置模式,并打开接口,加入vlan
Switch(config)# interface eth-0-1
Switch(config-if)# switch access vlan 10
Switch(config-if)# no shutdown
Switch(config-if)# exit
创建三层接口并配置IP地址
Switch(config)# interface vlan10
Switch(config-if)# ip address 6.6.6.5/24
Switch(config-if)# exit
步骤 3配置NTP鉴权key(可选)
配置NTP鉴权key 1, 并设置为信任key:
Switch(config)# ntp key 1 serverkey
Switch(config)# ntp trustedkey 1
步骤 4配置NTP服务器
Switch(config)# ntp server 6.6.6.6
如果使用鉴权key,则在配置server的同时指定(可选):
Switch(config)# ntp server 6.6.6.6 key 1
步骤 5配置NTP鉴权功能(可选)
一旦使能authentication,客户端交换机仅发送time-of-day请求到信任NTP服务器。
Switch(config)# ntp authentication enable
步骤 6配置NTP服务器/对端设备的访问控制规则(ACE)(可选)
Switch(config)# ntp ace 6.6.6.6 none
步骤 7退出配置模式
Switch(config)# end
步骤 8检查配置
Switch# show ntp
Current NTP configuration:
============================================================
NTP access control list:
6.6.6.6 mask 255.255.255.255 none
Unicast peer:
Unicast server:
6.6.6.6 key 1
Authentication: enabled
Local reference clock:
Disable management interface
Switch# show ntp status
Current NTP status:
============================================================
clock is synchronized
stratum: 7
reference clock: 6.6.6.6
frequency: 17.365 ppm
precision: 2**20
reference time: d14797dd.70b196a2 ( 1:54:37.440 UTC Thu Apr 7 2011)
root delay: 0.787 ms
root dispersion: 23.993 ms
peer dispersion: 57.717 ms
clock offset: -0.231 ms
stability: 6.222 ppm
Switch# show ntp associations
Current NTP associations:
remote refid st when poll reach delay offset disp
============================================================================
*6.6.6.6 127.127.1.0 6 50 128 37 0.778 -0.234 71.945
synchronized, + candidate, # selected, x falsetick, . excess, - outlier
配置 client/server 模式带外连接方式
1.组网拓扑
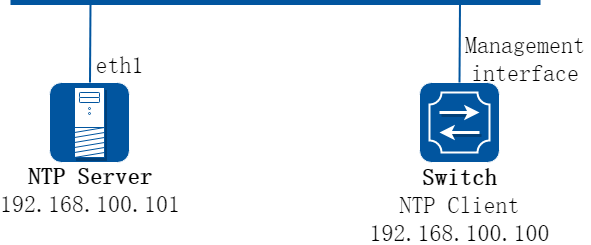
图9-2管理口连接NTP服务器
2.配置步骤
使用带外口连接,除了配置NTP服务器需要加上mgmt-if关键词,其它NTP相关配置均与带内口相似。
步骤 1进入配置模式
Switch# configure terminal
步骤 2配置NTP鉴权key (可选)
配置NTP鉴权key 1, 并设置为信任key:
Switch(config)# ntp key 1 serverkey
Switch(config)# ntp trustedkey 1
步骤 3配置NTP服务器
Switch(config)# ntp server mgmt-if 192.168.100.101
如果使用鉴权key,则在配置server的同时指定(可选):
Switch(config)# ntp server 192.168.100.101 key 1
步骤 4配置NTP鉴权功能(可选)
一旦使能authentication,客户端交换机仅发送time-of-day请求到信任NTP服务器。
Switch(config)# ntp authentication enable
步骤 5配置NTP服务器/对端设备的访问控制规则(ACE)(可选)
Switch(config)# ntp ace 192.168.100.101 none
步骤 6退出配置模式
Switch(config)# end
步骤 7检查配置
Switch# show ntp
Current NTP configuration:
============================================================
NTP access control list:
192.168.100.101 mask 255.255.255.255 none
Unicast peer:
Unicast server:
192.168.100.101(mgmt-if) key 1
Authentication: enabled
Local reference clock:
Only management interface
Switch# show ntp associations
Current NTP associations:
remote refid st when poll reach delay offset disp
==============================================================================
*192.168.100.101 127.127.1.0 3 27 64 1 1.328 2.033 433.075
* sys.peer, + candidate, # selected, x falsetick, . excess, - outlyer
NTP 服务器配置
下面以linux下的ntpd为例简单介绍以下网络中如何配置NTP服务器。
步骤 1配置服务器与交换机之间的三层网络
显示接口eth1的IP地址
[root@localhost octeon]# ifconfig eth1
eth1 Link encap:Ethernet HWaddr 00:08:C7:89:4B:AA
inet addr:6.6.6.6 Bcast:6.6.6.255 Mask:255.255.255.0
inet6 addr: fe80::208:c7ff:fe89:4baa/64 Scope:Link
UP BROADCAST RUNNING MULTICAST MTU:1500 Metric:1
RX packets:3453 errors:1 dropped:0 overruns:0 frame:1
TX packets:3459 errors:0 dropped:0 overruns:0 carrier:0
collisions:0 txqueuelen:1000
RX bytes:368070 (359.4 KiB) TX bytes:318042 (310.5 KiB)
通过ping命令检查网络连接是否可达
[root@localhost octeon]# ping 6.6.6.5
PING 6.6.6.5 (6.6.6.5) 56(84) bytes of data.
64 bytes from 6.6.6.5: icmp_seq=0 ttl=64 time=0.951 ms
64 bytes from 6.6.6.5: icmp_seq=1 ttl=64 time=0.811 ms
64 bytes from 6.6.6.5: icmp_seq=2 ttl=64 time=0.790 ms
步骤 2配置ntp.conf
[root@localhost octeon]# vi /etc/ntp.conf
server 127.127.1.0
# local clock
fudge 127.127.1.0 stratum 5
#
# Drift file. Put this in a directory which the daemon can write to.
# No symbolic links allowed, either, since the daemon updates the file
# by creating a temporary in the same directory and then rename()'ing
# it to the file.
#
driftfile /var/lib/ntp/drift
broadcastdelay 0.008
broadcast 6.6.6.255
#
# PLEASE DO NOT USE THE DEFAULT VALUES HERE. Pick your own, or remote
# systems might be able to reset your clock at will. Note also that
# ntpd is started with a -A flag, disabling authentication, that
# will have to be removed as well.
#
#disable auth
keys /etc/ntp/keys
trustedkey 1
步骤 3配置keys
[root@localhost octeon]# vi /etc/ntp/keys
#
# PLEASE DO NOT USE THE DEFAULT VALUES HERE. Pick your own, or remote
# systems might be able to reset your clock at will. Note also that
# ntpd is started with a -A flag, disabling authentication, that
# will have to be removed as well.
#
1 M serverkey
步骤 4启动ntpd服务器
[root@localhost octeon]# ntpd
9.3.1概述
简介
PTP(Precision Time Protocol)是一种用于同步计算机时钟的协议,由IEEE 1588标准定义。PTP旨在通过网络精确同步分布式系统中的时钟,以实现高精度的时间戳和时间同步,常用于工业自动化、交通运输、电力系统等需要高精度时间同步的领域。
PTP协议基于主从架构,其中一台设备充当主时钟(master)角色,其余设备充当从时钟(slave)角色。主时钟是网络中的时间源,它通过向从时钟传递时间戳来同步所有设备的时钟。PTP协议主要包含以下几个重要组件和步骤:
• 同步过程:主时钟在网络中发布时间信息,从时钟接收到时间信息后,会将其本地时钟调整到主时钟的时间。
• 传播延迟测量:主时钟会测量它自己发送时间信息到从时钟的传播延迟,以便从时钟可以校正自身时间。
• 时间偏移计算:从时钟根据主时钟的时间信息和自身接收到的本地时间信息,计算出自身时间与主时钟时间的偏移量。
• 时间校正:从时钟根据计算出的偏移量调整其本地时间,使本地时间与主时钟时间保持一致。
PTP协议包括1588和G.8275.1两个版本。 1588包括1588v1和1588v2,1588v1只能达到亚毫秒级的时间同步精度,而1588v2可以达到亚微秒级同步精度。 G.8275.1标准是由ITUT定义的精确时间同步标准,其与IEEE 1588标准类似,都是为了解决全网时间同步的问题。
在无线网络中,移动承载网与基站之间需要保持时钟同步。1588v2借助硬件辅助处理,可以达到亚微秒级的时间同步精度;同时成本更低,减小了对GPS的依赖。
背景
PTP(Precision Time Protocol)是一种用于同步计算机时钟的协议,由IEEE 1588标准定义。PTP协议的背景源于对高精度时间同步的需求,在许多领域如工业自动化、交通运输、电力系统等都需要高精度的时间同步。在这些应用场景中,分布式系统中的各个设备需要时间上的协调,以保证系统的稳定性和可靠性。
PTP协议解决的问题是提供一种高精度的时间同步解决方案,以确保分布式系统中的设备时间保持一致。相比于以前的技术,PTP协议具有以下优点:
• 高精度时间同步:PTP协议能够实现亚微秒级的时间同步精度,这比传统的NTP(Network Time Protocol)协议的亚秒级精度要高得多。高精度时间同步能够更好地满足许多实时应用的需求。
• 适用于任意网络拓扑:PTP协议适用于任意网络拓扑结构,无论是星型、树型还是网状结构,都能实现高精度的同步。这使得PTP协议具有更广泛的适用性。
• 硬件辅助处理:PTP协议借助硬件辅助处理,能够实现更快速的时间同步。硬件辅助处理可以大幅提高同步速度,降低延迟,提高系统的实时性能。
• 可扩展性:PTP协议设计灵活,可扩展性好,方便支持更多的设备和传感器。这使得PTP协议在物联网、智能家居等领域中得到了广泛应用。
• 独立于特定的传输介质:PTP协议不依赖于特定的传输介质,可以在以太网、光纤等传输介质上实现高精度时间同步。这使得PTP协议在实际应用中更加灵活和可靠。
总之,PTP协议作为一种高精度时间同步协议,相比以前的技术具有更高的精度、更广泛的适用性、更快速的处理速度、更好的扩展性和灵活性等优点。这使得PTP协议在许多领域中得到了广泛应用,成为一种重要的时间同步技术。
原理描述
缩略语与名词解释
表9-1缩略语
|
缩略语 |
含义 |
|
GPS |
全球定位系统 |
|
NTP |
网络时间协议 |
|
PTP |
精确时间协议 |
|
UTC |
协调世界时 |
|
TAI |
国际原子时 |
基本概念
以下是PTP中的一些重要概念,有助于用户理解PTP的功能,并基于这些理解来进行配置。
PTP域
PTP域(Precision Time Protocol domain)是指应用了PTP协议的网络,也称为PTP域。在一个PTP域中,有且只有一个主时钟,所有的设备都与该时钟保持同步。PTP域中的设备可以通过PTP协议交换时间信息,并进行时间校准和同步。
目前支持的PTP域范围为0-255,可通过命令行配置。默认属于域0。
时钟节点
PTP协议中有以下三种时钟类型:
• 边界时钟(BC):同一个PTP域内,存在两个及以上端口参与PTP时间同步的节点称为边界时钟。设备通过其中一个端口从上游设备同步时间,通过其余端口向下游设备发布时间。时钟源设备有两个及以上端口可以向下游发布时间时,也认为是边界时钟。
• 普通时钟(OC):同一个PTP域内,只存在单个端口参与PTP时间同步的节点称为普通时钟。普通时钟要么作为主时钟提供时钟源,要么作为最末一级终端,从其他的时钟源获取时钟,而不能作为中间节点把时钟向其他节点传递。
• 透传时钟(TC):透传时钟作为中间节点,收到PTP报文之后不进行终结,其内部有一个驻留时间桥来计算报文在本节点的驻留时间,并以此来修正时间标签再向下传递。延时测量支持端到端和点到点两种测量机制。
端口
设备上使能PTP协议的端口称为PTP端口,分为以下三种类型
主端口:发布同步时间的端口,可存在于BC或OC上。 从端口:接收同步时间的端口,可存在于BC或OC上。 被动端口:不接收同步时间,也不对外发布同步时间,闲置备用的端口,只存在于BC上。
最优时钟
最优时钟(Grandmaster Clock,GM)是PTP域中的最高层次时钟,也是整个PTP域的参考时间。PTP域中所有的时钟节点都按一定层次组织在一起,通过各时钟节点间PTP协议报文的交互,最优时钟的时间最终将被同步到整个PTP域中,因此也称其为时钟源。最优时钟可以通过手工配置静态指定,也可以通过BMC(Best Master Clock,最佳主时钟)协议动态选举。
BMC 算法
在BMC算法中,最优时钟是通过各时钟节点间PTP协议报文的交互进行动态选举的。各时钟节点之间通过交互Announce报文中所携带的最优时钟优先级、时间等级、时间精度等信息,最终选出一个节点作为PTP域的最优时钟。
BMC算法用来选取最优时钟时,基于以下可配置的字段:
• Priority1:时钟优先级1,支持用户配置,取值范围是0-255,取值越小优先级越高。默认为128。
• Clock-Class:时钟级别,支持6/7/13/14/52/58/187/193/248, 取值越低级别越高。默认为248。
• Clock-Accuracy:时钟精度,支持0x20-0x31/0xFE,取值越低精确度越高。默认为0xFE。
• Priority2:时钟优先级2,支持用户配置,取值范围是0-255,取值越小优先级越高。默认为128。
优先级选择的排序是Priority1>Clock-Class>Clock-Accuracy>Priority2,即先比较参选时间源的Priority1,若Priority1相同再比较Clock-Class,以此类推,优先级高、级别高、精度好的时钟成为最优时钟。
报文封装
PTP的时间同步过程通过PTP报文交互来实现。下游设备通过报文中携带的时间戳信息,计算出与主时钟之间的偏移和延迟,从而调整本地时钟来与主时钟同步。
PTP报文的时间戳是由芯片来打,芯片操作性能远远优于软件操作,因此可以更好的保证PTP时间同步的精度。
PTP报文支持二层封装(MAC封装)和三层封装(UDP封装),其中三层支持IPv4和IPv6。
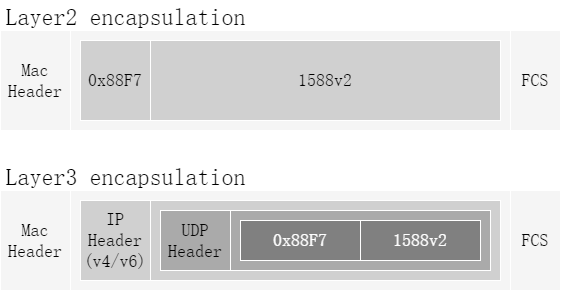
图9-3PTP报文封装
同步过程
PTP时间同步的过程包括以下步骤:
• 选择主从时钟:在PTP同步过程中,选择一个节点作为Master时钟,其他节点作为Slave时钟。Master时钟拥有高精度的时钟源,并通过网络将时间信息发送给Slave时钟,Slave时钟则通过校正自身时钟来实现同步。
• 时钟识别与初始化:节点首先需要识别各个时钟,并初始化Master时钟和Slave时钟的相关参数,包括时钟频率、延迟等。
• 时钟间的消息传递:PTP同步的核心机制是通过网络传递消息来实现时间同步。Master时钟会周期性地向网络中发送Sync消息,Slave时钟接收到Sync消息后会返回对应的Follow Up消息。
• 延迟补偿与校正:在PTP同步过程中,由于消息传输的延迟,需要对延迟进行补偿。通过计算消息的传输时间,可以补偿延迟,从而保证时间的准确性。同时,根据Master时钟和Slave时钟之间的时间差,Slave时钟对其时钟进行校正。
• 容错机制与优化:在实际网络中,由于网络拓扑复杂、链路质量不稳定等因素,可能会导致PTP同步的失败或者失去精度。因此,在PTP同步过程中,需要考虑容错机制的设计,提高系统的稳定性。同时,根据网络情况,可以对PTP同步过程进行优化,如选择更优的Master时钟、调整同步周期等。
• 时间一致性的验证:PTP同步过程中,还需要对时间一致性进行验证。常用的验证方法包括对Master时钟和Slave时钟之间的时间差进行监测,以及对同步精度进行评估。
这个过程可以通过IEEE 1588标准中的延迟请求-响应机制进行详细描述。主时钟会周期性发送Sync报文并记录报文离开的精确时间t1;从时钟会记录Sync报文到达的精确时间t2;主时钟发送包含t1时间的Follow_up报文;从时钟发送Delay_Req报文并记录报文离开的精确时间t3;主时钟记录Delay_Req报文到达的精确时间t4;随后,主时钟发送包含t4时间的Delay_Resp报文给从时钟。通过这种方式,主从时钟可以实现时间同步。
默认配置
表9-2默认配置
|
配置项 |
默认值 |
|
PTP功能 |
禁用 |
|
PTP设备类型 |
普通时钟 |
|
PTP优先级一与优先级二 |
128 |
|
PTP时戳模式 |
两步模式 |
|
PTP Announce周期 |
2秒 |
|
PTP Announce超时周期 |
8秒 |
|
PTP Delay_Req最小周期 |
1秒 |
|
PTP Pdelay_Req最小周期 |
1秒 |
|
PTP Sync周期 |
1秒 |
9.3.2配置举例
配置边界时钟/普通时钟
1.组网拓扑

图9-4PTP时钟域
如图所示,设置Switch1 为主时钟,向下游发布时间。Switch2从Switch1接收时间,更新本地时钟,并继续向下游设备发布时间。Switch3只接收时间。
2.配置步骤
步骤 1进入配置模式
Switch# configure terminal
Switch1配置
步骤 2全局使能PTP,并配置优先级一
Switch 1为普通时钟,只有一个端口用于发布时间。
配置优先级一为0,Switch 1为这个时钟域中最高优先级,成为该时钟域中的主时钟。
Switch1(config)# ptp global-enable
Switch1(config)# ptp priority1 0
步骤 3设置clock-step (可选)
PTP报文打时间戳支持one-step和two-step两种模式,默认为two-step模式。
• one-step: Sync报文带有本报文的时间戳。
• two-step:Sync报文不带有本报文的时间戳,后续Follow_UP报文带上Sync报文的时间戳。
建议统一PTP时钟域内设备选择相同的clock step。
Switch1(config)# ptp clock-step two-step
步骤 4设置延时测量机制 (可选)
延时测量机制支持如下两种:Normal和Peer。
• Normal:延时请求应答机制,根据主从时钟之间的整体链路延迟,计算时钟时间。(如果中间有透传时钟,应设为端到端模式)
• peer:对端延时机制,根据主从时钟之间的每一段链路延迟,计算时钟时间。(如果中间有透传时钟,应设为点到点模式)
默认配置为Normal模式。
Switch1(config)# interface eth-0-9
Switch1(config-if)# ptp delay-mechanism peer
步骤 5接口使能PTP
Switch1(config)# interface eth-0-9
Switch1(config-if)# ptp enable
Switch2配置
步骤 6配置设备类型为边界时钟,全局使能PTP
Switch2从Switch1接收时间,同时向Swith3发布时间,配置为边界时钟。
Switch2(config)# ptp device-type bc
Switch2(config)# ptp global-enable
步骤 7设置延时测量机制 (可选)
注意:与Switch1的延时测量机制保持一致。
Switch2(config)# interface eth-0-9
Switch2(config-if)# ptp delay-mechanism peer
Switch2(config-if)# exit
Switch2(config)# interface eth-0-18
Switch2(config-if)# ptp delay-mechanism peer
Switch2(config-if)# exit
步骤 8接口使能PTP
Switch2(config)# interface eth-0-9
Switch2(config-if)# ptp enable
Switch2(config-if)# exit
Switch2(config)# interface eth-0-18
Switch2(config-if)# ptp enable
Switch2(config-if)# exit
Switch3配置
步骤 9配置Switch3为从时钟,全局使能PTP
Switch3(config)# ptp global-enable
Switch3(config)# ptp slave-only
步骤 10设置延时测量机制 (可选)
注意:与Switch2的延时测量机制保持一致。
Switch3(config)# interface eth-0-18
Switch3(config-if)# ptp delay-mechanism peer
Switch3(config-if)# exit
步骤 11接口使能PTP
Switch3(config)# interface eth-0-18
Switch3(config-if)# ptp enable
Switch3(config-if)# exit
步骤 12退出配置模式
Switch(config)# end
步骤 13验证配置
验证Switch1全局PTP状态
Switch1# show ptp
---------------------- Global Configure ----------------------
PTP State : enable
Port Number : 1
Domain : 0
Slave Only : false
Clock Type : ordinary clock
Priority1 : 0
Priority2 : 128
Clock Accuracy : 0xfe
Clock Class : 248
Time Source : internal-oscillator(160)
UTC Offset : 34
Leap59 : false
Leap61 : false
Local Clock Identity : 60:4D:39:FF:FE:FF:C5:00
Set systime via PTP: : false
----------------------- BMC Properties -----------------------
Receive Member : (null)
Parent Clock Identity : 60:4D:39:FF:FE:FF:C5:00
Parent Port Number : 0
Mean Path Delay : 0
Offset From Master : 0
Step Removed : 0
GM Clock Identity : 60:4D:39:FF:FE:FF:C5:00
GM Priority1 : 0
GM Priority2 : 128
GM Clock Accuracy : 0xfe
GM Clock Class : 248
GM Time Source : internal-oscillator(160)
GM UTC Offset : 34
GM UTC Offset Valid : false
GM Time Scale : PTP
GM Time Traceable : false
GM Leap59 : false
GM Leap61 : false
GM Frequency Traceable : false
验证Switch1接口PTP状态
Switch1# show ptp interface eth-0-9
---------------------------------------------------------------
Interface : eth-0-9
----------------------- Port Configure -----------------------
PTP state : enable
Port ID : 60:4D:39:FF:FE:FF:C5:00@9
Delay Mechanism : peer
Step Mode : two
Port State : master
Announce Interval : 1
Sync Interval : 0
Announce Receipt Timeout : 4
PDelay_Req Interval : 0
Peer Mean Path Delay : 0
----------------------- Port Statistic -----------------------
Recv Packet Statistics
---------------------------------------------------------------
Announce : 5 Sync : 0
Delay_Req : 0 Pdelay_Req : 5248
Delay_Resp : 0 Pdelay_Resp : 5249
Follow_Up : 0 Pdelay_Resp_Follow_Up : 5249
Unknown : 0
Send Packet Statistics
---------------------------------------------------------------
Announce : 5345 Sync : 10609
Delay_Req : 0 Pdelay_Req : 10617
Delay_Resp : 0 Pdelay_Resp : 5248
Follow_Up : 10607 Pdelay_Resp_Follow_Up : 5248
Unknown : 0
Discard Packet Statistics
---------------------------------------------------------------
Announce : 0 Sync : 9
Delay_Req : 0 Pdelay_Req : 0
Delay_Resp : 0 Pdelay_Resp : 0
Follow_Up : 9 Pdelay_Resp_Follow_Up : 0
Unknown : 0
验证Switch2全局PTP状态
Switch2# show ptp
---------------------- Global Configure ----------------------
PTP State : enable
Port Number : 2
Domain : 0
Slave Only : false
Clock Type : boundary clock
Priority1 : 128
Priority2 : 128
Clock Accuracy : 0xfe
Clock Class : 248
Time Source : internal-oscillator(160)
UTC Offset : 34
Leap59 : false
Leap61 : false
Local Clock Identity : 5E:C4:DC:FF:FE:AE:78:00
Set systime via PTP: : false
----------------------- BMC Properties -----------------------
Receive Member : eth-0-9
Parent Clock Identity : 60:4D:39:FF:FE:FF:C5:00
Parent Port Number : 9
Mean Path Delay : 0
Offset From Master : 0
Step Removed : 1
GM Clock Identity : 60:4D:39:FF:FE:FF:C5:00
GM Priority1 : 0
GM Priority2 : 128
GM Clock Accuracy : 0xfe
GM Clock Class : 248
GM Time Source : internal-oscillator(160)
GM UTC Offset : 34
GM UTC Offset Valid : false
GM Time Scale : PTP
GM Time Traceable : false
GM Leap59 : false
GM Leap61 : false
GM Frequency Traceable : false
验证Switch2外部PTP主时钟信息
Switch2# show ptp foreign-master
Foreign_master_port_identity Qualification Interface
---------------------------------------------------------------
*60:4D:39:FF:FE:FF:C5:00@9 true eth-0-9
验证Switch2接口PTP状态
Switch2# show ptp interface eth-0-9
---------------------------------------------------------------
Interface : eth-0-9
----------------------- Port Configure -----------------------
PTP state : enable
Port ID : 5E:C4:DC:FF:FE:AE:78:00@9
Delay Mechanism : peer
Step Mode : two
Port State : slave
Announce Interval : 1
Sync Interval : 0
Announce Receipt Timeout : 4
PDelay_Req Interval : 0
Peer Mean Path Delay : 0
----------------------- Port Statistic -----------------------
Recv Packet Statistics
---------------------------------------------------------------
Announce : 2944 Sync : 5837
Delay_Req : 0 Pdelay_Req : 5876
Delay_Resp : 0 Pdelay_Resp : 5876
Follow_Up : 5837 Pdelay_Resp_Follow_Up : 5875
Unknown : 0
Send Packet Statistics
---------------------------------------------------------------
Announce : 15 Sync : 30
Delay_Req : 0 Pdelay_Req : 5876
Delay_Resp : 0 Pdelay_Resp : 5876
Follow_Up : 27 Pdelay_Resp_Follow_Up : 5876
Unknown : 0
Discard Packet Statistics
---------------------------------------------------------------
Announce : 0 Sync : 9
Delay_Req : 0 Pdelay_Req : 0
Delay_Resp : 0 Pdelay_Resp : 0
Follow_Up : 9 Pdelay_Resp_Follow_Up : 0
Unknown : 0
Switch2# show ptp interface eth-0-18
---------------------------------------------------------------
Interface : eth-0-18
----------------------- Port Configure -----------------------
PTP state : enable
Port ID : 5E:C4:DC:FF:FE:AE:78:00@18
Delay Mechanism : peer
Step Mode : two
Port State : master
Announce Interval : 1
Sync Interval : 0
Announce Receipt Timeout : 4
PDelay_Req Interval : 0
Peer Mean Path Delay : 0
----------------------- Port Statistic -----------------------
Recv Packet Statistics
---------------------------------------------------------------
Announce : 0 Sync : 0
Delay_Req : 0 Pdelay_Req : 5680
Delay_Resp : 0 Pdelay_Resp : 5680
Follow_Up : 0 Pdelay_Resp_Follow_Up : 5680
Unknown : 0
Send Packet Statistics
---------------------------------------------------------------
Announce :2950 Sync : 5860
Delay_Req : 0 Pdelay_Req : 5868
Delay_Resp : 0 Pdelay_Resp : 5680
Follow_Up : 5858 Pdelay_Resp_Follow_Up : 5680
Unknown : 0
Discard Packet Statistics
---------------------------------------------------------------
Announce : 0 Sync : 0
Delay_Req : 0 Pdelay_Req : 0
Delay_Resp : 0 Pdelay_Resp : 0
Follow_Up : 0 Pdelay_Resp_Follow_Up : 0
Unknown : 0
验证Switch3全局PTP状态
Switch3# show ptp
---------------------- Global Configure ----------------------
PTP State : enable
Port Number : 1
Domain : 0
Slave Only : true
Clock Type : ordinary clock
Priority1 : 128
Priority2 : 128
Clock Accuracy : 0xfe
Clock Class : 255
Time Source : internal-oscillator(160)
UTC Offset : 34
Leap59 : false
Leap61 : false
Local Clock Identity : A0:D2:25:FF:FE:B1:F8:00
Set systime via PTP: : false
----------------------- BMC Properties -----------------------
Receive Member : eth-0-18
Parent Clock Identity : 5E:C4:DC:FF:FE:AE:78:00
Parent Port Number : 18
Mean Path Delay : 0
Offset From Master : 0
Step Removed : 2
GM Clock Identity : 60:4D:39:FF:FE:FF:C5:00
GM Priority1 : 0
GM Priority2 : 128
GM Clock Accuracy : 0xfe
GM Clock Class : 248
GM Time Source : internal-oscillator(160)
GM UTC Offset : 34
GM UTC Offset Valid : false
GM Time Scale : PTP
GM Time Traceable : false
GM Leap59 : false
GM Leap61 : false
GM Frequency Traceable : false
验证Switch3外部PTP主时钟信息
Switch3# show ptp foreign-master
Foreign_master_port_identity Qualification Interface
---------------------------------------------------------------
*5E:C4:DC:FF:FE:AE:78:00@18 true eth-0-18
验证Switch 3接口PTP状态
Switch3# show ptp interface eth-0-18
---------------------------------------------------------------
Interface : eth-0-18
----------------------- Port Configure -----------------------
PTP state : enable
Port ID : A0:D2:25:FF:FE:B1:F8:00@18
Delay Mechanism : peer
Step Mode : two
Port State : slave
Announce Interval : 1
Sync Interval : 0
Announce Receipt Timeout : 4
PDelay_Req Interval : 0
Peer Mean Path Delay : 0
----------------------- Port Statistic -----------------------
Recv Packet Statistics
---------------------------------------------------------------
Announce : 3472 Sync : 6884
Delay_Req : 0 Pdelay_Req : 6919
Delay_Resp : 0 Pdelay_Resp : 6917
Follow_Up : 6884 Pdelay_Resp_Follow_Up : 6917
Unknown : 0
Send Packet Statistics
---------------------------------------------------------------
Announce : 0 Sync : 0
Delay_Req : 0 Pdelay_Req : 6920
Delay_Resp : 0 Pdelay_Resp : 6919
Follow_Up : 0 Pdelay_Resp_Follow_Up : 6919
Unknown : 0
Discard Packet Statistics
---------------------------------------------------------------
Announce : 0 Sync : 11
Delay_Req : 0 Pdelay_Req : 0
Delay_Resp : 0 Pdelay_Resp : 3
Follow_Up : 11 Pdelay_Resp_Follow_Up : 3
Unknown : 0
配置透传时钟
1.组网拓扑
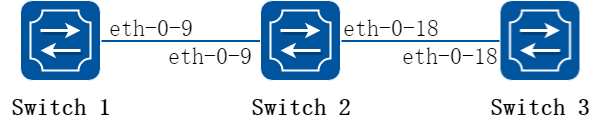
图9-5PTP时钟域
如图所示,设置Switch1 为主时钟,向下游发布时间。Switch2从Switch1接收时间,计算本设备上的延时,并继续向下游设备发布时间,但是Switch2不更新本地时钟。Switch3只接收时间。
2.配置步骤
Switch2配置
在这个例子中,Switch1和Switch3的配置与前例相同。下面修改Swith2的配置。
步骤 1进入配置模式
Switch2# configure terminal
步骤 2配置设备类型为透传时钟,全局使能PTP
透传时钟支持p2ptc和e2etc.
• p2ptc: 对应的普通时钟/边界时钟上,延时测量机制应该为peer
• e2etc: 对应的普通时钟/边界时钟上,延时测量机制应该为normal
Switch2(config)# ptp device-type p2ptc
Switch2(config)# ptp global-enable
步骤 3接口模式启用PTP
Switch2(config)# interface range eth-0-9 , eth-0-18
Switch2(config-if)# ptp enable
Switch2(config-if)# exit
步骤 4退出配置模式
Switch2(config)# end
步骤 5验证配置
验证Switch 2全局PTP状态
Switch2# show ptp
---------------------- Global Configure ----------------------
PTP State : enable
Port Number : 2
Primary Domain : 0
Clock Type : peer-to-peer transparent clock
Local Clock ID : 5E:C4:DC:FF:FE:AE:78:00
验证Switch2接口PTP状态
Switch2# show ptp interface eth-0-9
---------------------------------------------------------------
Interface : eth-0-9
----------------------- Port Configure -----------------------
PTP state : enable
Port ID : 5E:C4:DC:FF:FE:AE:78:00@9
Delay Mechanism : peer
Step Mode : two
Port State : normal
PDelay_Req Interval : 0
Peer Mean Path Delay : 0
----------------------- Port Statistic -----------------------
Recv Packet Statistics
---------------------------------------------------------------
Announce : 6545 Sync : 12985
Delay_Req : 0 Pdelay_Req : 13024
Delay_Resp : 0 Pdelay_Resp : 13016
Follow_Up : 12985 Pdelay_Resp_Follow_Up : 13016
Unknown : 0
Send Packet Statistics
---------------------------------------------------------------
Announce : 15 Sync : 30
Delay_Req : 0 Pdelay_Req : 13021
Delay_Resp : 0 Pdelay_Resp : 13024
Follow_Up : 27 Pdelay_Resp_Follow_Up : 13024
Unknown : 0
Discard Packet Statistics
---------------------------------------------------------------
Announce : 0 Sync : 9
Delay_Req : 0 Pdelay_Req : 0
Delay_Resp : 0 Pdelay_Resp : 5
Follow_Up : 9 Pdelay_Resp_Follow_Up : 5
Unknown : 0
Switch2# show ptp interface eth-0-18
---------------------------------------------------------------
Interface : eth-0-18
----------------------- Port Configure -----------------------
PTP state : enable
Port ID : 5E:C4:DC:FF:FE:AE:78:00@18
Delay Mechanism : peer
Step Mode : two
Port State : normal
PDelay_Req Interval : 0
Peer Mean Path Delay : 0
----------------------- Port Statistic -----------------------
Recv Packet Statistics
---------------------------------------------------------------
Announce : 0 Sync : 0
Delay_Req : 0 Pdelay_Req : 13026
Delay_Resp : 0 Pdelay_Resp : 13019
Follow_Up : 0 Pdelay_Resp_Follow_Up : 13019
Unknown : 0
Send Packet Statistics
---------------------------------------------------------------
Announce : 6651 Sync : 13208
Delay_Req : 0 Pdelay_Req : 13212
Delay_Resp : 0 Pdelay_Resp : 13026
Follow_Up : 13208 Pdelay_Resp_Follow_Up : 13026
Unknown : 0
Discard Packet Statistics
---------------------------------------------------------------
Announce : 0 Sync : 0
Delay_Req : 0 Pdelay_Req : 0
Delay_Resp : 0 Pdelay_Resp : 6
Follow_Up : 0 Pdelay_Resp_Follow_Up : 6
Unknown : 0
验证Switch3全局PTP状态
Switch3# show ptp
---------------------- Global Configure ----------------------
PTP State : enable
Port Number : 1
Domain : 0
Slave Only : true
Clock Type : ordinary clock
Priority1 : 128
Priority2 : 128
Clock Accuracy : 0xfe
Clock Class : 255
Time Source : internal-oscillator(160)
UTC Offset : 34
Leap59 : false
Leap61 : false
Local Clock Identity : A0:D2:25:FF:FE:B1:F8:00
Set systime via PTP: : false
----------------------- BMC Properties -----------------------
Receive Member : eth-0-18
Parent Clock Identity : 60:4D:39:FF:FE:FF:C5:00
Parent Port Number : 9
Mean Path Delay : 0
Offset From Master : 0
Step Removed : 1
GM Clock Identity : 60:4D:39:FF:FE:FF:C5:00
GM Priority1 : 0
GM Priority2 : 128
GM Clock Accuracy : 0xfe
GM Clock Class : 248
GM Time Source : internal-oscillator(160)
GM UTC Offset : 34
GM UTC Offset Valid : false
GM Time Scale : PTP
GM Time Traceable : false
GM Leap59 : false
GM Leap61 : false
GM Frequency Traceable : false
验证Switch3外部PTP主时钟信息
Switch3# show ptp foreign-master
Foreign_master_port_identity Qualification Interface
---------------------------------------------------------------
*60:4D:39:FF:FE:FF:C5:00@9 true eth-0-18
9.3.3 参考文献
• IEEE std 1588TM-2008: IEEE Standard for a Precision Clock Synchronization Protocol for Networked Measurement and Control Systems.
• ITU-T G.8275.1/Y.1369.1 AMD 1-2017: Precision time protocol telecom profile for phase/time synchronization with full timing support from the network;Amendment 1
9.4.1概述
简介
loopback是一个私有的模块,实现物理层的环回功能。它包含两种环回模式:一种是internal,另一种是external。
loopback只能配置在物理口上:
• 如果配置为internal模式,所有期望从此端口出去的报文被环回到该端口。
• 如果配置为external模式,所有进入此端口的报文被环回回去,此模式还可以指定是否进行源、目的MAC的交换,如果交换MAC,芯片会重新计算CRC校验和
9.4.2配置举例
配置external 环回模式
1.组网拓扑
![]()
图9-6external topology
2.配置步骤
步骤 1进入配置模式
Switch# configure terminal
步骤 2进入接口配置模式,并配置为external环回模式, 并且指定进行源、目的MAC交换
Switch(config)# interface eth-0-1
Switch(config-if)# no shutdown
Switch(config-if)# loopback external mac-address swap
步骤 3退出配置模式
Switch(config-if)# end
步骤 4检查配置
Switch# show loopback
Interface Type DestIntf SwapMac
- $$------------------------------------------
eth-0-1 external - yes
- $$------------------------------------------
配置 internal环回模式
1.组网拓扑
![]()
图9-7Internal topology
2.配置步骤
步骤 1进入配置模式
Switch# configure terminal
步骤 2进入接口配置模式,配置为internal环回模式
Switch(config)# interface eth-0-1
Switch(config-if)# no shutdown
Switch(config-if)# exit
Switch(config)# interface eth-0-2
Switch(config-if)# no shutdown
Switch(config-if)# loopback internal
步骤 3退出配置模式
Switch(config-if)# end
步骤 4检查配置
Switch# show loopback
Interface Type DestIntf SwapMac
- $$------------------------------------------
eth-0-2 internal - -
- $$------------------------------------------
9.5.1 概述
简介
L2 ping是一个用于检测交换机间的连通性的工具。Window、Linux上的IP ping是通过ICMP协议实现,工作在3层网络上的,而L2 ping工作在二层网络。
当系统发出L2 Ping请求时,以ether type 0x9009为标志的协议报文将进入二层网络,当通过二层网络到达对端指定目的端口时,如果该端口上使能了l2 ping response,对端系统就会回复l2 ping请求。
9.5.2 配置举例
1.组网拓扑
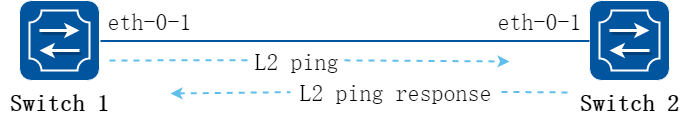
图9-8ping a switch port
2.配置步骤
以下配置无特殊说明的部分,Switch1和Switch2相同:
步骤 1进入配置模式
Switch# configure terminal
步骤 2全局使能l2 ping
Switch(config)# l2 ping enable
步骤 3进入接口配置模式并打开接口
Switch(config)# interface eth-0-1
Switch(config-if)# no shutdown
步骤 4使能l2 ping 回复功能
在Switch2配置:
Switch2(config-if)# l2 ping response enable
步骤 5退出配置模式
Switch(config-if)# end
步骤 6使用 L2 Ping
在Switch1执行:
Switch1# l2 ping 001e.0808.58f1 interface eth-0-1 count 10 interval 1 timeout 2
Sending 10 L2 ping message(s):
64 bytes from 001e.0808.58f1: sequence = 0, time = 10ms
64 bytes from 001e.0808.58f1: sequence = 1, time = 15ms
64 bytes from 001e.0808.58f1: sequence = 2, time = 13ms
64 bytes from 001e.0808.58f1: sequence = 3, time = 12ms
64 bytes from 001e.0808.58f1: sequence = 4, time = 20ms
64 bytes from 001e.0808.58f1: sequence = 5, time = 21ms
64 bytes from 001e.0808.58f1: sequence = 6, time = 12ms
64 bytes from 001e.0808.58f1: sequence = 7, time = 16ms
64 bytes from 001e.0808.58f1: sequence = 8, time = 14ms
64 bytes from 001e.0808.58f1: sequence = 9, time = 17ms
L2 ping completed.
- $$---------------------------------
10 packet(s) transmitted, 10 received, 0 % packet loss
001e.0808.58f1是对端接口地址。用户可以指定ping的次数、间隔、以及超时时间。
9.6.1 概述
简介
RMON是一个Internet工程任务组(IETF)标准的监测规范,允许不同的网络代理和控制台系统交换网的监测数据。用户可以结合RMON和交换机中的简单网络管理协议(SNMP)代理来监控网络中流经交换机的数据流量。 RMON是一种标准的监测规范,它定义了一套统计与RMON兼容的控制台系统或网络探头一起提供全面的网络故障诊断,规划和性能优化的信息。
9.6.2 配置举例
1.组网拓扑
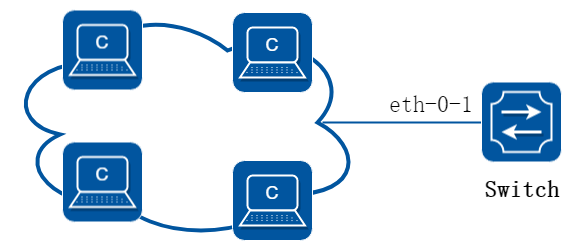
图9-9rmon
2.配置步骤
步骤 1进入配置模式
Switch# configure terminal
步骤 2进入接口配置模式并创建一条统计和一条历史记录
Switch(config)# interface eth-0-1
Switch(config-if)# rmon collection stats 1 owner test
Switch(config-if)# rmon collection history 1 buckets 100 interval 1000 owner test
Switch(config-if)# exit
步骤 3创建一条事件,并指定触发事件后行为是发送log和trap
Switch(config)# rmon event 1 log trap public description test_event owner test
步骤 4创建一条警告,关注ETHERSTATSBROADCASTPKTS这个值,每1000秒统计一次,如果超过1000或者低于1都会触发事件1
Switch(config)# rmon alarm 1 etherStatsEntry.6.1 interval 1000 delta rising-threshold 1000 event 1 falling-threshold 1 event 1 owner test
步骤 5退出配置模式
Switch(config)# end
步骤 6检查配置
Switch# show rmon statistics
Rmon collection index 1
Statistics ifindex = 1, Owner: test
Input packets 0, octets 0, dropped 0
Broadcast packets 0, multicast packets 0, CRC alignment errors 0, collisions 0
Undersized packets 0, oversized packets 0, fragments 0, jabbers 0
# of packets received of length (in octets):
64: 0, 65-127: 0, 128-255: 0
256-511: 0, 512-1023: 0, 1024-max: 0
Switch# show rmon history
History index = 1
Data source ifindex = 1
Buckets requested = 100
Buckets granted = 100
Interval = 1000
Owner: test
Switch# show rmon event
Event Index = 1
Description: test_event
Event type Log & Trap
Event community name: public
Last Time Sent = 00:00:00
Owner: test
Switch# show rmon alarm
Alarm Index = 1
Alarm status = VALID
Alarm Interval = 1000
Alarm Type is Delta
Alarm Value = 00
Alarm Rising Threshold = 1000
Alarm Rising Event = 1
Alarm Falling Threshold = 1
Alarm Falling Event = 1
Alarm Owner is test
9.7.1 概述
简介
SNMP是管理进程(NMS)和代理进程(Agent)之间的通信协议。它规定了在网络环境中对设备进行监视和管理的标准化管理框架、通信的公共语言、相应的安全和访问控制机制。网络管理员使用SNMP功能可以查询设备信息、修改设备的参数值、监控设备状态、自动发现网络故障、生成报告等。 SNMP具有以下技术优点:
• 基于TCP/IP互联网的标准协议,传输层协议一般采用UDP。
• 自动化网络管理。网络管理员可以利用SNMP 平台在网络上的节点检索信息、修改信息、发现故障、完成故障诊断、进行容量规划和生成报告。
• 屏蔽不同设备的物理差异,实现对不同厂商产品的自动化管理。SNMP 只提供最基本的功能集,使得管理任务与被管设备的物理特性和实际网络类型相对独立,从而实现对不同厂商设备的管理。
• 简单的请求—应答方式和主动通告方式相结合,并有超时和重传机制。
• 报文种类少,报文格式简单,方便解析,易于实现。
• SNMPv3 版本提供了认证和加密安全机制,以及基于用户和视图的访问控制功能,增强了安全性。
原理描述
SNMP基于以下RFC:
• SNMPv1:在RFC1157中定义
• SNMPv2C:在RFC1901中定义
• SNMPv3:在RFC2273至2275中定义
以下简单描述了SNMP协议的条目和概念:
• Agent:Agent是网络设备中的一个应用模块,用于维护被管理设备的信息数据并响应NMS的请求,把管理数据汇报给发送请求的NMS。Agent接收到NMS的请求信息后,完成查询或修改操作,并把操作结果发送给NMS,完成响应。同时,当设备发生故障或者其他事件的时候,Agent会主动发送Trap信息给NMS,通知设备当前的状态变化。
• Management Information Base (MIB):任何一个被管理的资源都表示成一个对象,称为被管理的对象。MIB是被管理对象的集合。它定义了被管理对象的一系列属性:对象的名称、对象的访问权限和对象的数据类型等。每个Agent都有自己的MIB。MIB也可以看作是NMS和Agent之间的一个接口,通过这个接口,NMS可以对Agent中的每一个被管理对象进行读/写操作,从而达到管理和监控设备的目的。
• Engine ID:一个网络节点的唯一ID
• Trap:Trap是Agent主动向NMS 发送的信息,用于报告一些紧急的重要事件(如被管理设备重新启动等)。Trap 报文有两种:通用Trap 和企业自定义Trap。设备支持的通用Trap 包括authentication、coldstart、linkdown、linkup 和warmstart 五种,其它均为企业自定义Trap。企业自定义Trap由模块生成。因为Trap 信息通常较多,会占用设备内存,从而影响设备性能,所以建议用户根据需要开启指定模块的Trap 功能,生成相应的Trap 报文。
9.7.2 配置举例
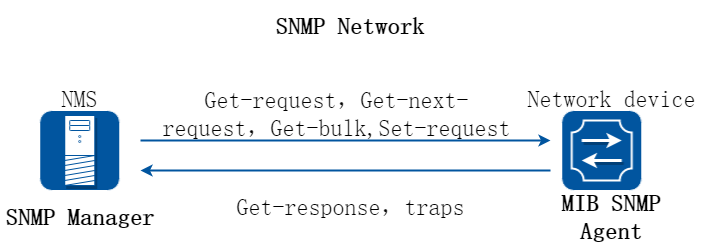
图9-10snmp
如图所示,SNMP代理从MIB收集数据。SNMP代理可以发送trap或通报特定事件给接收和处理trap的管理员。 Trap用于向管理员通报一些异常信息,如用户认证异常,设备重启,链路状态变化(端口打开或关闭),MAC地址追踪等等。 SNMP也能响应管理员发出的MIB相关的请求,例如get、get-next、set等。
启用SNMP
步骤 1进入配置模式
Switch# configure terminal
步骤 2全局使能snmp
Switch(config)# snmp-server enable
步骤 3退出配置模式
Switch(config)# end
步骤 4检查配置
Switch# show running-config
snmp-server enable
团体字符串配置
您可以使用SNMP团体字符串来定义的SNMP管理者和代理之间的关系。团体字符串的行为就像一个密码,以允许访问代理交换机。您可以指定一个或多个团体字符。
• 一个MIB视图,它定义了所有给定团体可访问的MIB对象子集。
• 设置访问的MIB对象的读、写权限。
在特权EXEC模式,开始按照下列步骤来配置交换机上的一个团体字符串,以下步骤配置完成后,就可以实现SNMP的基本读写功能。
步骤 1进入配置模式
Switch# configure terminal
步骤 2团体字符串
配置一个视图名字 “DUT”(可选)。 配置团体名字 “public” 读写权限,可访问的视图为 “DUT”。View DUT为可选字段。
Switch(config)# snmp-server view DUT included 1.1.1
Switch(config)# snmp-server community public read-write view DUT
步骤 3退出配置模式
Switch(config)# end
步骤 4检查配置
Switch# show running-config
snmp-server enable
snmp-server view DUT included 1.1.1
snmp-server community public read-only view DUT
SNMPv3 Groups, Users and Accesses配置
你可以为SNMP服务器指定一个 (engine ID),创建一个SNMP组,在SNMP组中加入用户、设置权限。
在特权EXEC模式,开始按照下列步骤操作,在交换机上配置SNMP。
步骤 1进入配置模式
Switch# configure terminal
步骤 2配置snmp全局属性
配置engineID; 配置用户名和密码以及验证类型; 创建SNMP组; 设置组内成员的权限。
Switch(config)# snmp-server engineID 8000123456
Switch(config)# snmp-server usm-user usr1 authentication md5 mypassword privacy des yourpassword
Switch(config)# snmp-server group grp1 user usr1 security-model usm
Switch(config)# snmp-server access grp1 security-model usm noauth
步骤 3退出配置模式
Switch(config)# end
步骤 4检查配置
Switch# show running-config
snmp-server engineID 8000123456
snmp-server usm-user usr1 authentication md5 mypassword privacy des yourpassword
snmp-server group grp1 user usr1 security-model usm
snmp-server access grp1 security-model usm noauth
SNMPv1 和 SNMPv2 的notifications配置
在特权EXEC模式,开始在交换机上配置的SNMP按照下列步骤操作。
步骤 1进入配置模式
Switch# configure terminal
步骤 2配置snmp全局属性
开启所有Trap; 配置目的IPv4地址以及团体名Public;配置源IPv4地址; 配置目的IPv6地址以及团体名Public;配置源IPv6地址。
Switch(config)# snmp-server trap enable all
Switch(config)# snmp-server trap target-address 10.0.0.2 community public
Switch(config)# snmp-server trap source-address 1.1.1.1
Switch(config)# snmp-server trap target-address 2001:1000::1 community public
Switch(config)# snmp-server trap source-address 3001::2
步骤 3退出配置模式
Switch(config)# end
步骤 4检查配置
Switch# show running-config
snmp-server trap target-address 10.0.0.2 community public
snmp-server trap target-address 2001:1000::1 community public
snmp-server trap source-address 1.1.1.1
snmp-server trap source-address 3001::2
snmp-server trap enable vrrp
snmp-server trap enable igmp snooping
snmp-server trap enable ospf
snmp-server trap enable pim
snmp-server trap enable stp
snmp-server trap enable system
snmp-server trap enable coldstart
snmp-server trap enable warmstart
snmp-server trap enable linkdown
snmp-server trap enable linkup
SNMPv3 的notifications配置
步骤 1进入配置模式
Switch# configure terminal
步骤 2配置snmp全局属性
开启所有Trap; 创建一个Trap消息条目; 配置目的IPv4地址以及notification类型; 配置目的IPv6地址以及notification类型; 配置用户的地址参数。
Switch(config)# snmp-server trap enable all
Switch(config)# snmp-server notify notif1 tag tmptag trap
Switch(config)# snmp-server target-address targ1 param parm1 10.0.0.2 taglist tmptag
Switch(config)# snmp-server target-address t1 param p1 2001:1000::1 taglist tag1
Switch(config)# snmp-server target-params parm1 user usr1 security-model v3 message-processing v3 noauth
步骤 3退出配置模式
Switch(config)# end
步骤 4检查配置
Switch# show running-config
snmp-server notify notif1 tag tmptag trap
snmp-server target-address t1 param p1 2001:1000::1 taglist tag1
snmp-server target-address targ1 param parm1 10.0.0.2 taglist tmptag
snmp-server target-params parm1 user usr1 security-model v3 message-processing v3 noauth
snmp-server trap enable vrrp
snmp-server trap enable igmp snooping
snmp-server trap enable ospf
snmp-server trap enable pim
snmp-server trap enable stp
snmp-server trap enable system
snmp-server trap enable coldstart
snmp-server trap enable warmstart
snmp-server trap enable linkdown
snmp-server trap enable linkup
9.8.1 概述
简介
Sflow 即Sampled Flow,是一种监视进入设备流量的技术。它在监视设备上应用,通过一种采样机制以一定速率采样,然后将采样信息送到监视server。在server端可以查看多个agent的流量情况。 Sflow有两种类型的采样信息:一种是端口的统计信息,一种是被采样报文的头部。
sflow的一些默认配置如下:
|
参数 |
默认值 |
|
Global sflow |
disabled |
|
sflow on port |
disable |
|
Collector udp port |
6343 |
|
counter interval time |
20 seconds |
9.8.2 配置举例
1.组网拓扑
图9-11sflow
2.配置步骤
步骤 1进入配置模式
Switch# configure terminal
步骤 2全局使能sflow
Switch(config)# sflow enable
步骤 3设置sflow全局属性
配置本地直连监视器端口的agent IP地址和监视器的地址和UDP端口号,UDP端口号可以不配,表示用默认端口6343。
Switch(config)# sflow agent ip 3.3.3.1
Switch(config)# sflow collector 3.3.3.2 6342
IPv6的Agent地址和监视器地址配置:
Switch(config)# sflow agent ipv6 2001:2000::2
Switch(config)# sflow collector 2001:2000::1
![]() sflow功能正常工作,agent和监视器都至少需要配置一个。不关心具体是IPv4或IPv6的。
sflow功能正常工作,agent和监视器都至少需要配置一个。不关心具体是IPv4或IPv6的。
修改端口的统计信息每15秒(默认20)发送一次(可选):
Switch(config)# sflow counter interval 15
步骤 4进入接口配置模式并配置接口属性
Switch(config)# interface eth-0-1
Switch(config-if)# no switchport
Switch(config-if)# no shutdown
Switch(config-if)# ip address 15.1.1.1/24
Switch(config-if)# exit
Switch(config)# interface eth-0-2
Switch(config-if)#no switchport
Switch(config-if)# no shutdown
Switch(config-if)# ip address 16.1.1.1/24
Switch(config-if)# exit
Switch(config)# interface eth-0-3
Switch(config-if)# no switchport
Switch(config-if)# no shutdown
Switch(config-if)# ip address 3.3.3.1/24
Switch(config-if)# exit
步骤 5在eth-0-1入方向使能sflow
Switch(config)# interface eth-0-1
Switch(config-if)# sflow flow-sampling rate 8192
Switch(config-if)# sflow flow-sampling enable input
Switch(config-if)# sflow counter-sampling enable
Switch(config-if)# exit
步骤 6退出配置模式
Switch(config)# end
步骤 7检查配置
用如下命令查看sflow配置:
Switch# show sflow
sFlow Version: 5
sFlow Global Information:
Agent IPv4 address : 3.3.3.1
Agent IPv6 address : 2001:1000::2
Counter Sampling Interval : 15 seconds
Collector 1:
IPv4 Address: 3.3.3.2
vrf: N/A
Port: 6342
Collector 2:
IPv6 Address: 2001:1000::1
vrf: N/A
Port: 6343
sFlow Port Information:
Flow-Sample Flow-Sample
Port Counter Flow Direction Rate
- $$------------------------------------------------------
eth-0-1 Enable Enable Input 8192
9.9.1 概述
简介
链路层发现协议LLDP(Link Layer Discovery Protocol)是IEEE 802.1ab 中定义的第二层发现协议。第二层发现(Layer 2 Discovery)可以准确定位设备附带的接口及其连接的信息,包括端口的VLAN属性和支持的协议类型等,并显示出了客户端、交换机、路由器和应用服务器以及网络服务器之间的路径。这些详细的信息对快速获取相连设备的拓扑状态、设备间的配置冲突、查询网络失败的根源将很有帮助。
9.9.2 配置举例
1.组网拓扑
图9-12lldp
2.配置步骤
步骤 1进入配置模式
Switch# configure terminal
步骤 2全局使能lldp
Switch(config)# lldp enable
步骤 3进入接口配置模式,配置接口lldp属性
Switch(config)# interface eth-0-9
Switch(config)# no shutdown
Switch(config-if)# no lldp tlv 8021-org-specific vlan-name
Switch(config-if)# lldp tlv med location-id ecs-elin 1234567890
Switch(config-if)# lldp enable txrx
Switch(config-if)# exit
步骤 4配置定时器(可选)
配置LLDP 报文传输间隔为40秒; 配置LLDP报文传输延迟为3秒; 配置LLDP重新使能延迟为1秒。
Switch(config)# lldp timer msg-tx-interval 40
Switch(config)# lldp timer tx-delay 3
Switch(config)# lldp timer reinit-delay 1
步骤 5退出配置模式
Switch(config)# end
步骤 6检查配置
用如下命令查看LLDP配置:
Switch# show lldp local config
LLDP global configuration:
============================================================
LLDP function global enabled : YES
LLDP msgTxHold : 4
LLDP msgTxInterval : 40
LLDP reinitDelay : 1
LLDP txDelay : 3
Switch# show lldp local config interface eth-0-9
LLDP configuration on interface eth-0-9 :
============================================================
LLDP admin status : TXRX
Basic optional TLV Enabled:
Port Description TLV
System Name TLV
System Description TLV
System Capabilities TLV
Management Address TLV
IEEE 802.1 TLV Enabled:
Port Vlan ID TLV
Port and Protocol Vlan ID TLV
Protocol Identity TLV
IEEE 802.3 TLV Enabled:
MAC/PHY Configuration/Status TLV
Power Via MDI TLV
Link Aggregation TLV
Maximum Frame Size TLV
LLDP-MED TLV Enabled:
Med Capabilities TLV
Network Policy TLV
Location Identification TLV
Extended Power-via-MDI TLV
Inventory TLV
Switch# show running-config
!
lldp enable
lldp timer msg-tx-interval 40
lldp timer reinit-delay 1
lldp timer tx-delay 3
!
interface eth-0-9
lldp enable txrx
no lldp tlv 8021-org-specific vlan-name
lldp tlv med location-id ecs-elin 1234567890
!
Switch# show lldp neighbor
Local Port management interface has 0 neighbor(s)
Local Port eth-0-1 has 0 neighbor(s)
Local Port eth-0-2 has 0 neighbor(s)
…
Local Port eth-0-9 has 2 neighbor(s)
Remote LLDP Information of port eth-0-9
============================================================
Neighbor Index : 1
Chassis ID type: Mac address
Chassis ID : 48:16:be:a4:d7:09
Port ID type : Interface Name
Port ID : eth-0-9
TTL : 160
Expired time: 134
…
Location Identification :
ECS ELIN: 1234567890
9.10.1 概述
简介
我们把网络节点之间的数据流量看作一条条不同的流,这些流穿梭于数据网络之上。出于管理或其他需求,这些流所包含的信息非但有趣、有用,并且很有必要获取。为此,我们需要一个统一的机制来展示这些流的信息,在此之前,我们还需要将这些信息从不同的网络节点送往统一的收集设备。基于这样的需求,IPFIX应运而生了。
IPFIX(全称为IP Flow Information Export), 其前身是思科的私有方法”NetFlow”。IPFIX在功能上类似于NetFlow,是基于NetFlow的版本9诞生的。
原理描述
协议标准:参考 RFC7011/RFC7012 (IPFIX version 10)
图9-13IPFIX 基本组网
IPFIX 主要涉及到三个设备:Exporter、Collector和Analyzer。
• Exporter 对网络流量进行分析处理,并将统计结果发送给Collector。
• Collector 和 Analyzer 对数据进行解析、提取,提供后续处理,例如生成图像等。
交换机一般作为Exporter工作,下面介绍Exporter中的一些概念。
• 流的建立:交换机需要支持识别并建立一条流。这条流也许包含相同的MAC、相同的IP、相同的VLAN等等。具体报文的哪些字段相同才会被认为是同一条流,可以由用户根据实际需求来配置。
• 流的老化:当一条流建立之后,如果它长时间没有流量通过,会占用系统资源。所以交换机需要支持流的老化。用户可以根据实际需求配置老化时间。如果不配置,系统也有默认的老化时间,目前是1800秒。(一条流1800秒之内没有任何报文通过,这条流就被删除了)
• 信息采集:支持设置间隔采样频率,例如100个报文中随机采样1个。采样间隔越大,则收集到的信息越粗略,但是系统负担较轻;反之如果采集所有报文,信息会很全面,但是系统性能压力大。用户可以自行选择一个适中的采样频率。
• 信息输出:交换机支持将收集的流信息送往收集器。用户可以指定发送报文的目的地址、出接口、DSCP值等参数。
IPFIX报文需要传输模版和流信息两类内容,模版用来告诉收集器和解析器如何解释后面的流信息,例如第一个字段为源MAC,第二字段为源IP……以此类推。流信息则根据这个模版来填充。用户可以分别设置模版和流信息的发送间隔、发送条件等。发送间隔如果不配置,默认都是600秒。发送条件是指,流建立时立即发送、流老化时立即发送等。
图9-14IPFIX 报文示意
如上图所示,IPFIX报文以UDP格式封装,默认目的端口号为2055。IPFIX 报文主体中可包含多个Set,set的内容可以是模版,也可以是流信息。
9.10.2 配置举例
IPFIX 基本配置
1.组网拓扑
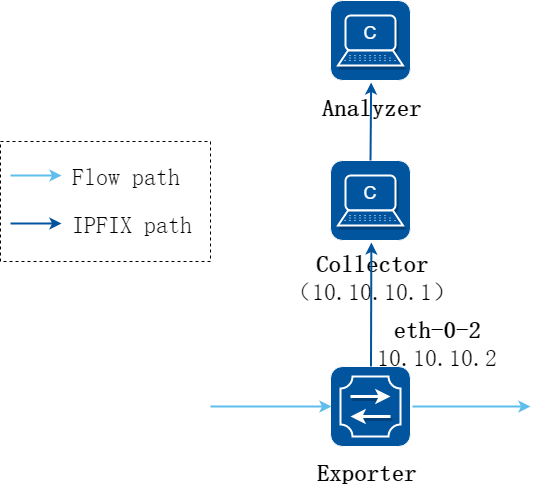
图9-15IPFIX 基本配置
2.配置步骤
步骤 1进入配置模式
Switch# configure terminal
步骤 2配置三层接口
Switch(config)# interface eth-0-2
Switch(config-if)# no shutdown
Switch(config-if)# no switchport
Switch(config-if)# ip address 10.10.10.2/24
Switch(config-if)# exit
步骤 3配置recorder
IPFIX可以根据报文的五元组信息、VLAN、VNI等信息来标记一条流。用户可以根据实际需求,在Recorder中指定以那些特征来区分流。下面配置中,配置了源MAC、源目的IP、VNI,也就是当报文源MAC、源目的IP、VNI全部都相同时,认为这些报文属于同一个流。
另外需要配置collect counter,下面配置中,collect counter bytes和collect counter packets都配置了,即同时记录字节数和报文数。
Switch(config)# ipfix recorder recorder1
Switch(Config-ipfix-reocrder)# match mac source address
Switch(Config-ipfix-reocrder)# match ipv4 source address mask 32
Switch(Config-ipfix-reocrder)# match ipv4 destination address mask 32
Switch(Config-ipfix-reocrder)# match vxlan-vni
Switch(Config-ipfix-reocrder)# collect counter bytes
Switch(Config-ipfix-reocrder)# collect counter packets
Switch(Config-ipfix-reocrder)# exit
步骤 4配置流的老化时间(可选)
设置老化时间为300秒。默认值 1800秒。
Switch(config)# ipfix global
Switch(Config-ipfix-global)# flow aging 300
步骤 5配置sampler
在IPFIX sample中,配置采样频率。下面配置中,频率为1/100。
Switch(config)# ipfix sampler sampler1
Switch(Config-ipfix-sampler)# 1 out-of 100
Switch(Config-ipfix- sampler)# exit
步骤 6配置exporter
在IPFIX exporter中,配置IPFIX报文的封装、发送方式。 在下面的配置中,发送报文的目的IP为10.10.10.1(即Collector的地址), 从eth-0-2口发出,发送间隔为200秒。
“event flow end timeout”配置表示,当flow超时之后,会立即发送数据报文给Collector。
Switch(config)# ipfix exporter exporter1
Switch(Config-ipfix-exporter)# destination 10.10.10.1
Switch(Config-ipfix-exporter)# source interface eth-0-2
Switch(Config-ipfix-exporter)# flow data timeout 200
Switch(Config-ipfix-exporter)# event flow end timeout
Switch(Config-ipfix-exporter)# exit
步骤 7配置monitor
将上述recorder和exporter绑定到同一个monitor下。
Switch(config)# ipfix monitor monitor1
Switch(Config-ipfix-monitor)# recorder recorder1
Switch(Config-ipfix-monitor)# exporter exporter1
Switch(Config-ipfix-monitor)# exit
步骤 8进入接口配置模式,并在接口上应用ipfix monitor
可以同时指定monitor和sampler,由sampler配置决定采样率。(如果不选sample,那么默认的采样率为100%)
Switch(config)# interface eth-0-1
Switch(config-if)# ipfix monitor input monitor1 sampler sampler1
Switch(config-if)# exit
步骤 9退出配置模式
Switch(config)# end
步骤 10检查配置
用如下命令查看IPFIX配置:
Switch# show ipfix global
IPFIX global information:
Flow cache aging interval : 300 seconds
Flow cache export interval : 5 seconds
Flow cache dropped packet wraparound threshold : 1023
Flow cache jitter threshold : 65535 ns
Flow cache latency threshold : 16777215 ns
feature hardware-telemetry: disable
Switch# show ipfix recorder recorder1
IPFIX recorder information:
Name : recorder1
Description :
Match info :
match Source Mac Address
match IPv4 Source Address
match IPv4 Destination Address
match Vxlanvni
Collect info :
collect Flow Byte Number
collect Flow Packet Number
Switch# show ipfix exporter exporter1
IPFIX exporter information:
Name : exporter1
Description :
Exporter Interface : eth-0-2
Domain ID : 0
Collector Name : 10.10.10.1
IPFIX message protocol : UDP
IPFIX message destination Port : 2055
IPFIX message TTL value : 255
IPFIX message DSCP value : 63
IPFIX data interval : 200
IPFIX template interval : 1800
IPFIX exporter events :
Flow aging event
Switch# show ipfix sampler sampler1
IPFIX sampler information:
Name : sampler1
Description :
Rate : 100
Switch# show ipfix monitor monitor1
IPFIX monitor information:
Name : monitor1
Description :
Recorder : recorder1
exporter : exporter1
flow mirror packet : 0
flow mirror destination : NA
9.11.1 概述
简介
Hardware Monitor是一个在硬件层面实现的网络流量监控工具,它可以实时地监控网络拥塞情况,并及时上报网络管理员以采取相应的流量管理策略。Hardware Monitor包括两个模块:Buffer Monitor和Latency Monitor。
• Buffer Monitor: Buffer Monitor用来监控端口的buffer cell的占用情况,并实时上报拥塞事件。
• Latency Monitor:Latency Monitor用来监控报文的转发时延,并实时上报延迟事件,以及丢弃高转发时延的报文。
除此之外,Hardware Monitor还提供水印功能和通告功能。
• 水印功能:水印功能用来记录一段时间内端口的buffer cell被占用的最大值和报文转发时延的最大值。
• 通告功能:通告功能用来将Hardware Monitor模块采集到的数据及上报的事件发送给指定的通告服务器。
原理描述
Hardware Monitor分为Buffer Monitor模块和Latency Monitor模块,以下分别描述其原理。
1.Buffer Monitor原理描述
Buffer Monitor模块原理示意图如下:
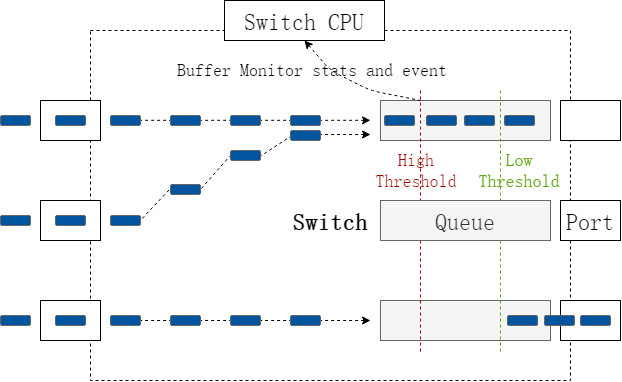
图9-16Buffer Monitor原理示意图
当转发到交换机某一接口的流量超过其最大的转发能力时,交换机会将无法立即转发的报文暂时缓存起来,等到拥塞缓解或解除的时候再转发。交换机芯片用来缓存报文的最小单元为buffer cell,通过监控端口的buffer cell的占用情况可以判断网络的拥塞状况。
在使能了Buffer Monitor功能的接口上,交换机会以10ms为周期采样该接口的buffer cell占用数值,并打上时间戳。当接口占用的buffer cell的数量超过High Threshold时,交换机会立即向CPU上报一个拥塞开始事件并附上事件发生时的时间戳;当接口占用的buffer cell的数量由High Threshold减少到低于Low Threshold时,交换机会立即向CPU上报一个拥塞结束事件并附上事件发生时的时间戳。如果开启了Buffer Monitor模块的通告功能,系统会以管理员定义的时间间隔向通告服务器发送一个Buffer Stats Notify报文,其内容是被监控端口的名称、buffer cell占用情况以及数据上报时的时间戳;并且当拥塞事件发生和结束时,系统会立即向通告服务器发送一个Micro-burst Start Notify和Micro-burst Stop Notify报文,其内容也是被监控端口的名称、buffer cell占用情况以及事件上报时的时间戳。
2.Latency Monitor原理描述
Latency Monitor模块原理示意图如下:
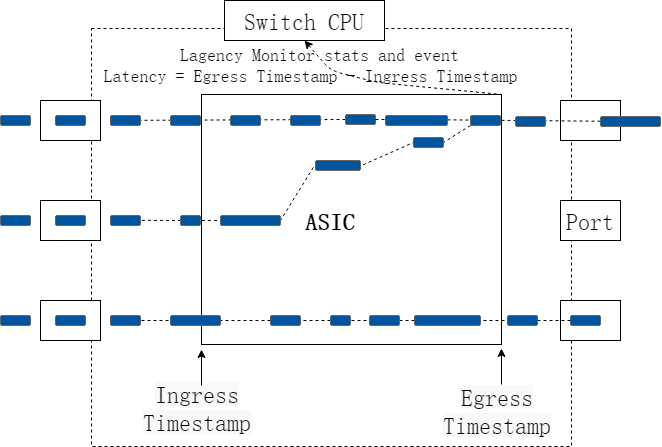
图9-17Latency Monitor原理示意图
Latency Monitor模块可以统计一个报文在交换机内部的转发时延,用户可以配置8个时间区间,在开启了Latency Monitor功能的接口上,交换机会以10ms为周期统计落在各个区间上的报文个数。
当报文的转发时延超过High Threshold时,交换机会立即向CPU上报一个延迟开始事件并附上事件发生时的时间戳、报文的转发时延和报文的入端口信息;当报文的转发时延低于Low Threshold时,交换机会立即向CPU上报一个延迟结束事件并附上事件发生时的时间戳、报文的转发时延和报文的入端口信息。在开启高转发时延报文丢弃功能的端口上,如果报文的的转发时延超过Drop Threshold时,该报文会被丢弃。如果开启了Latency Monitor的通告功能,系统会以管理员定义的时间间隔向通告服务器发送一个Latency Stats Notify报文,其内容是被监控端口的名称和这段时间内落在各个时间区间上的报文个数;并且当延迟事件开始和结束时,系统会立即向通告服务器发送一个Latency Event Start Notify和Latency Event Stop Notify报文,其内容是被监控端口的名称,触发该事件的报文的入端口名称,触发该事件的报文的转发时延和该事件发生时的时间戳。
9.11.2 配置举例
Buffer Monitor配置
如下示例,显示了如何使能eth-0-9端口的Buffer Monitor功能和系统的拥塞事件上报功能,配置触发拥塞事件上报的高、低阈值为3200个buffer cell、64个buffer cell。
步骤 1进入配置模式
Switch# configure terminal
步骤 2进入端口配置模式
Switch(config)# interface eth-0-9
步骤 3开启该端口的buffer monitor功能
Switch(config-if)# hardware buffer-monitor enable
步骤 4退出端口配置模式
Switch(config-if)# exit
步骤 5开启系统的拥塞事件上报功能
Switch(config)# hardware buffer-monitor micro-burst enable
步骤 6配置触发拥塞事件的高低阈值
Switch(config)# hardware buffer-monitor micro-burst threshold low 64 high 3200
步骤 7退出配置模式
Switch(config)# end
步骤 8检查配置
Switch# show hardware buffer-monitor status
Hardware buffer micro-burst event: enable
Hardware buffer micro-burst threshold low: 64 high: 3200
Port buffer monitor
-----------------------------------------------------------------------------
eth-0-1 disable
eth-0-2 disable
eth-0-3 disable
eth-0-4 disable
eth-0-5 disable
eth-0-6 disable
eth-0-7 disable
eth-0-8 disable
eth-0-9 enable
eth-0-10 disable
eth-0-11 disable
eth-0-12 disable
eth-0-13 disable
eth-0-14 disable
eth-0-15 disable
eth-0-16 disable
eth-0-17 disable
eth-0-18 disable
eth-0-19 disable
eth-0-20 disable
eth-0-21 disable
eth-0-22 disable
eth-0-23 disable
eth-0-24 disable
eth-0-25 disable
eth-0-26 disable
步骤 9显示Buffer Monitor统计数据
查看Buffer Monitor在eth-0-9端口记录的前20条数据:
Switch# show hardware buffer-monitor interface eth-0-9 20
Brief CLI issued at : 08:39:15 UTC Fri Jan 28 2022
Flag (micro-burst) : S - Start record E - End record U - Update record
Flag Time Total count
--------------------------------------------------------
- 08:39:11.698066906 58368
- 08:39:11.688067287 58367
- 08:39:11.678067668 58365
- 08:39:11.668068049 58366
- 08:39:11.658068430 58369
- 08:39:11.648068811 58368
- 08:39:11.638069192 58367
- 08:39:11.628069573 58366
- 08:39:11.618069954 58370
- 08:39:11.608070335 58367
- 08:39:11.598070716 58368
- 08:39:11.588071097 58369
- 08:39:11.578071478 58368
- 08:39:11.568071859 58367
- 08:39:11.558072240 58367
- 08:39:11.548072621 58369
- 08:39:11.538073002 58366
- 08:39:11.528073383 58368
- 08:39:11.518073764 58369
- 08:39:11.508074145 58369
查看eth-0-9端口上的拥塞事件:
Switch# show hardware buffer-monitor micro-burst interface eth-0-9
Brief CLI issued at : 09:20:11 UTC Fri Jan 28 2022
Flag (micro-burst) : S - Start record E - End record
Flag Time(ns) Total count Threshold level
---------------------------------------------------------------------
E 09:20:06.892459921 64 0
S 09:19:05.087003316 3200 0
Latency Monitor配置
如下示例,显示了如何使能eth-0-9端口的Latency Monitor功能和高转发时延丢弃功能,配置系统的8个延时时间区间与设置触发延迟事件的阈值和高转发时延报文丢弃的阈值。
步骤 1进入配置模式
Switch# configure terminal
步骤 2进入端口配置模式
Switch(config)# interface eth-0-9
步骤 3开启该端口的Latency Monitor功能
Switch(config-if)# hardware latency-monitor enable
步骤 4开启该端口的高转发时延报文丢弃功能(可选)
Switch(config-if)# hardware latency-monitor drop
步骤 5配置该端口丢弃高转发时延报文的阈值(可选)
配置丢弃高转发时延报文的阈值是第6个时间区间:
Switch(config-if)# hardware latency-monitor threshold drop 6
步骤 6退出端口配置模式
Switch(config-if)# exit
步骤 7配置系统的8个延迟时间区间
Switch(config)# hardware latency-monitor range 640 3200 6400 12800 25600 128000 256000
步骤 8配置触发延迟事件的高低阈值
配置触发延迟事件的高阈值为报文的转发时延达到64000ns,低阈值为报文的转发时延降到1280ns:
Switch(config)# hardware latency-monitor threshold event low 1280 high 64000
步骤 9退出配置模式
Switch(config)# end
步骤 10检查配置
Switch# show hardware latency-monitor status
Hardware latency monitor range(ns)
Range1: 1-640 Range2: 640-3200 Range3: 3200-6400 Range4: 6400-12800
Range5: 12800-25600 Range6: 25600-128000 Range7:128000-256000 Range8:256000-more
Port monitor event low event high drop-threshold
-----------------------------------------------------------------------------
eth-0-1 disable disable disable disable
eth-0-2 disable disable disable disable
eth-0-3 disable disable disable disable
eth-0-4 disable disable disable disable
eth-0-5 disable disable disable disable
eth-0-6 disable disable disable disable
eth-0-7 disable disable disable disable
eth-0-8 disable disable disable disable
eth-0-9 enable 1280 64000 6
eth-0-10 disable disable disable disable
eth-0-11 disable disable disable disable
eth-0-12 disable disable disable disable
eth-0-13 disable disable disable disable
eth-0-14 disable disable disable disable
eth-0-15 disable disable disable disable
eth-0-16 disable disable disable disable
eth-0-17 disable disable disable disable
eth-0-18 disable disable disable disable
eth-0-19 disable disable disable disable
eth-0-20 disable disable disable disable
eth-0-21 disable disable disable disable
eth-0-22 disable disable disable disable
eth-0-23 disable disable disable disable
eth-0-24 disable disable disable disable
eth-0-25 disable disable disable disable
eth-0-26 disable disable disable disable
步骤 11显示Latency Monitor统计数据
查看Latency Monitor在eth-0-9端口统计的前16条数据:
Switch# show hardware latency-monitor interface eth-0-9 16
Brief CLI issued at: 19:32:34 UTC Mon Feb 07 2022
Format: 0-640 - the count of packets with latency between 0ns and 640ns
0 640 3200 6400 12800 25600 128000 256000
- $$ - - - - - - -
Time 640 3200 6400 12800 25600 128000 256000 more
09:52:57.366657807 35 2447 4492 3633 994 1256 1207 581
09:52:57.356657807 41 2519 4743 3675 1016 1463 1001 180
09:52:57.346657807 55 2752 5017 3957 961 1213 637 51
09:52:57.336657807 43 2463 4629 3519 877 1266 1123 721
09:52:57.326657807 41 2464 4827 3900 959 1243 805 403
09:52:57.316657807 37 2681 4951 3767 1015 1187 750 256
09:52:57.306657807 49 2411 4614 3541 848 1254 1175 754
09:52:57.296657807 32 2581 4571 3635 1038 1475 1138 167
09:52:57.286657807 41 2666 5036 3875 885 1057 874 207
09:52:57.276657807 38 2506 4802 3792 976 1163 1105 260
09:52:57.266657807 41 2464 4827 3900 959 1243 805 403
09:52:57.256657807 37 2681 4951 3767 1015 1187 750 256
09:52:57.246657807 49 2411 4614 3541 848 1254 1175 754
09:52:57.236657807 32 2581 4571 3635 1038 1475 1138 167
09:52:57.226657807 41 2666 5036 3875 885 1057 874 207
09:52:57.216657807 38 2506 4802 3792 976 1163 1105 260
查看Latency Monitor在eth-0-9端口的平均延迟的前16条数据:
Switch# show hardware latency-monitor avg-latency interface eth-0-9 16
Average latency calculation interval : 5s
Time Average Latency(ns)
----------------------------------------------------------------------
09:53:17.866657807 4924
09:53:12.866657807 4437
09:53:07.866657807 4170
09:53:02.866657807 4296
09:52:57.866657807 4278
09:52:52.866657807 4519
09:52:47.866657807 4146
09:52:42.866657807 4715
09:52:37.866657807 4360
09:52:32.866657807 4028
09:52:27.866657807 4278
09:52:22.866657807 4519
09:52:17.866657807 4146
09:52:12.866657807 4715
09:52:07.866657807 4360
09:52:02.866657807 4028
查看eth-0-9端口上报的延迟事件:
Switch# show hardware latency-monitor event interface eth-0-9
Brief CLI issued at: 10:06:13 UTC Fri Jan 28 2022
Flags : S - Start record E - End record
Time RangeId Latency(ns) Status Source Port
----------------------------------------------------------------------------------
10:06:13.098854000 6 63994 S eth-0-3
10:06:13.098849000 2 1280 E eth-0-3
10:06:13.098845000 6 64032 S eth-0-3
10:06:13.098840000 2 1282 E eth-0-3
10:06:13.098836000 6 64036 S eth-0-3
10:06:13.098832000 2 1304 E eth-0-1
通告功能配置
系统网络拓扑如下:
1.组网拓扑
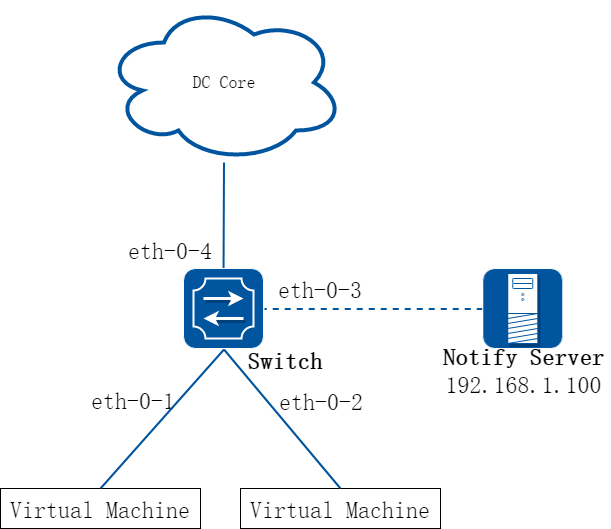
图9-18通告功能网络拓扑
以下示例说明了如何开启eth-0-4端口的Hardware Monitor功能,并配置通告服务器地址为192.168.1.100,使能Hardware Monitor的数据及事件上报功能。
2.配置步骤
步骤 1进入配置模式
Switch# configure terminal
步骤 2配置通告服务器IP地址
Switch(config)# hardware monitor notify server 192.168.1.100
步骤 3配置发送通告报文的周期
Switch(config)# hardware monitor notify interval 20
步骤 4配置eth-0-3端口为三层口
Switch(config)# interface eth-0-3
Switch(config-if)# no switchport
步骤 5配置eth-0-3端口的IP地址
Switch(config-if)# ip address 192.168.1.1/24
步骤 6退出端口配置模式
Switch(config-if)# exit
步骤 7使能拥塞事件上报功能并配置触发拥塞事件的高低阈值
Switch(config)# hardware buffer-monitor micro-burst enable
Switch(config)# hardware buffer-monitor micro-burst threshold low 32 high 256
步骤 8配置系统的8个延迟时间区间和触发延迟事件的高低阈值
Switch(config)# hardware latency-monitor range 640 1280 2560 5120 10240 20480 40960
Switch(config)# hardware latency-monitor threshold event low 64 high 6400
步骤 9进入端口配置模式
Switch(config)# interface eth-0-4
步骤 10开启该端口的Buffer monitor功能及Buffer Monitor相关的报文通告功能
Switch(config-if)# hardware buffer-monitor enable
Switch(config-if)# hardware buffer-monitor notify
步骤 11开启该端口的Latency Monitor功能及Latency Monitor相关的报文通告功能
Switch(config-if)# hardware latency-monitor enable
Switch(config-if)# hardware latency-monitor notify
步骤 12退出配置模式
Switch(config-if)# end
步骤 13检查配置
Switch# show hardware buffer-monitor status
Hardware buffer micro-burst event: enable
Hardware buffer micro-burst threshold low: 32 high: 256
Port buffer monitor
-----------------------------------------------------------------------------
eth-0-1 disable
eth-0-2 disable
eth-0-3 disable
eth-0-4 enable
eth-0-5 disable
eth-0-6 disable
eth-0-7 disable
eth-0-8 disable
eth-0-9 disable
eth-0-10 disable
eth-0-11 disable
eth-0-12 disable
eth-0-13 disable
eth-0-14 disable
eth-0-15 disable
eth-0-16 disable
eth-0-17 disable
eth-0-18 disable
eth-0-19 disable
eth-0-20 disable
Switch# show hardware latency-monitor status
Hardware latency monitor range(ns)
Range1: 1-640 Range2: 640-1280 Range3: 1280-2560 Range4: 2560-5120
Range5: 5120-10240 Range6: 10240-20480 Range7: 20480-40960 Range8: 40960-more
Port monitor event low event high drop-threshold
-----------------------------------------------------------------------------
eth-0-1 disable disable disable disable
eth-0-2 disable disable disable disable
eth-0-3 disable disable disable disable
eth-0-4 enable 64 6400 disable
eth-0-5 disable disable disable disable
eth-0-6 disable disable disable disable
eth-0-7 disable disable disable disable
eth-0-8 disable disable disable disable
eth-0-9 disable disable disable disable
eth-0-10 disable disable disable disable
eth-0-11 disable disable disable disable
eth-0-12 disable disable disable disable
eth-0-13 disable disable disable disable
eth-0-14 disable disable disable disable
eth-0-15 disable disable disable disable
eth-0-16 disable disable disable disable
eth-0-17 disable disable disable disable
eth-0-18 disable disable disable disable
eth-0-19 disable disable disable disable
eth-0-20 disable disable disable disable